Sizing Ductwork Correctly: A Manual D Workflow
Size ductwork by pulling design CFM from your Manual J load calculation, confirming equipment output through Manual S, then finding your blower’s available static pressure (ASP) after subtracting component losses. From there, calculate the design friction rate with FR = (ASP × 100) / TEL, and read your trunk and branch sizes off a Manual D friction chart, ductulator, or duct calculator. Skip the shortcuts and this sequence gets you airflow that matches what the equipment was actually designed to deliver.
The method depends on a few things being right before you start:
- Accurate design CFM per room, not a rule-of-thumb guess
- A real blower performance table for your selected equipment
- Total effective length (TEL) that includes every fitting, not just straight duct
- A friction rate you calculate, not one you assume
Key Takeaways
Proper duct sizing works only when design CFM, blower ASP, and calculated friction rate all feed into a single Manual D–aligned workflow rather than separate guesses.
| Point | Details |
|---|---|
| Start with Manual J and Manual S | Design CFM and blower ESP must come from real load and equipment data, not estimates. |
| Calculate ASP before anything else | Subtract filter, coil, and grille losses from blower ESP to get an accurate pressure budget. |
| Compute friction rate, don’t assume it | Use FR = (ASP × 100) / TEL for every project since it changes with layout and equipment. |
| Check velocity limits | Keep supply runs at or below 900 fpm and return runs at or below 700 fpm. |
| Diagnose before replacing equipment | High TESP, noise, or frozen coils usually trace back to filters, dampers, or branch sizing first. |
Where to Verify This Workflow
- ACCA Manual D remains the primary standard for the friction-rate procedure and equipment prerequisites covered here.
- Friction charts, fitting equivalent-length tables, and blower performance tables live in the full Manual D reference document and in your equipment manufacturer’s submittal data.
- For a deeper look at the friction-rate math with real numbers, the Energy Vanguard worked example is worth reviewing alongside your own calculations.
Table of Contents
- What You Need Before Sizing Ductwork
- How Do You Calculate Proper Duct Sizing Step By Step?
- Why Manual D Friction Budgeting Beats Rule-of-Thumb Sizing
- Formulas, Reference Figures, and a Worked Duct Sizing Example
- Getting Accurate Results From a Ductulator or Duct Calculator
- Does Duct Shape and Material Affect Sizing?
- How Do You Diagnose Poorly Sized Ductwork?
- A Field Pro’s Take on Closing the Design Gap
- Sources
What You Need Before Sizing Ductwork
Bad inputs produce bad duct sizes no matter how careful your math is afterward. Before you touch a friction chart, gather these:
- Room-by-room CFM from Manual J, or design CFM per zone if you’re working a simpler layout
- Blower performance table for the selected equipment, pulled from the Manual S output, showing external static pressure (ESP) at various speeds
- Component pressure drops for filters, coils, and grilles, ideally from manufacturer data sheets
- A duct layout sketch identifying the critical path, the longest or highest resistance run, since that’s what drives your friction rate
- Register and grille selections, since their pressure drop counts against your budget too
For tools, keep a ductulator or online duct size calculator on hand, a tape measure for verifying actual run lengths, and either Manual D worksheets or compliant software to keep the friction-rate math organized. Skipping the equivalent-length count for fittings is the most common shortcut that wrecks an otherwise careful calculation.
How Do You Calculate Proper Duct Sizing Step By Step?
Proper duct sizing follows a fixed order. Each step depends on the one before it, so working out of sequence is where most sizing errors start.
- Establish design CFM. Pull room-by-room airflow targets from Manual J, then confirm the equipment’s actual output at your design conditions using Manual S.
- Find blower ESP. Locate the blower performance table for the selected equipment and identify external static pressure at the operating speed you’ll run.
- Subtract component losses. Filters, coils, and grilles all eat into that pressure budget. Skipping this step is one of the fastest ways to undersize a system, since whatever pressure those components consume is pressure the ducts never get to use. What remains is your available static pressure, or ASP.
- Calculate Total Effective Length (TEL). Measure the critical path’s straight duct length, then add the equivalent length (EL) of every elbow, tee, boot, and transition along that path.
- Compute the friction rate. Use FR = (ASP × 100) / TEL. This gives you the pressure drop, in inches of water column per 100 feet, that your duct sizing needs to hit.
- Read duct sizes off a friction chart. Match each branch’s CFM against your calculated friction rate using a Manual D chart, ductulator, or calculator.
- Check velocities. Supply runs should stay at or below 900 fpm; returns at or below 700 fpm. If a duct exceeds those limits, bump up the size and recalculate.
Pro Tip: Budget pressure from the blower outward, not from the ducts inward. Subtract filter, coil, and grille losses first to get your true ASP, then let that number drive every duct size downstream. Working the other direction tends to leave the branches farthest from the air handler starved for CFM.
Why Manual D Friction Budgeting Beats Rule-of-Thumb Sizing
Manual D exists because duct resistance and blower output have to match, not fight each other. It’s the industry-recognized standard for residential duct design, and it treats Manual J load calculations and Manual S equipment selection as non-negotiable prerequisites, not optional extras.
The friction rate itself is project-specific. There’s no universal number that works across every layout, because ASP and TEL change with every equipment model and every duct run. Contractors who plug in a generic 0.10 in.wc/100 ft figure instead of calculating FR from their own ASP and TEL routinely end up with ducts that don’t match the blower they’re actually running.
Skip the friction budgeting and here’s what shows up later:
- Rooms far from the air handler run short on airflow while rooms nearby get too much
- Registers whistle or roar because velocity limits got ignored
- Blower motor amp draw climbs as the system fights higher static pressure than it was designed for
- Coils lose efficiency, and in humid climates, ice up
Formulas, Reference Figures, and a Worked Duct Sizing Example
Three formulas carry the entire Manual D workflow:
- Friction rate: FR = (ASP × 100) / TEL
- Velocity: Velocity = CFM / Area (convert duct area from square inches to square feet before dividing)
- Total Effective Length: TEL = straight duct length + sum of fitting equivalent lengths (EL)
Design friction rates for residential and light commercial work typically land between 0.06 and 0.14 in.wc per 100 feet, though your actual number comes from the calculation, not this range.
Design CFM runs roughly 400 CFM per ton as a quick sanity check, though this table is a starting reference, not a substitute for the friction-rate calculation.
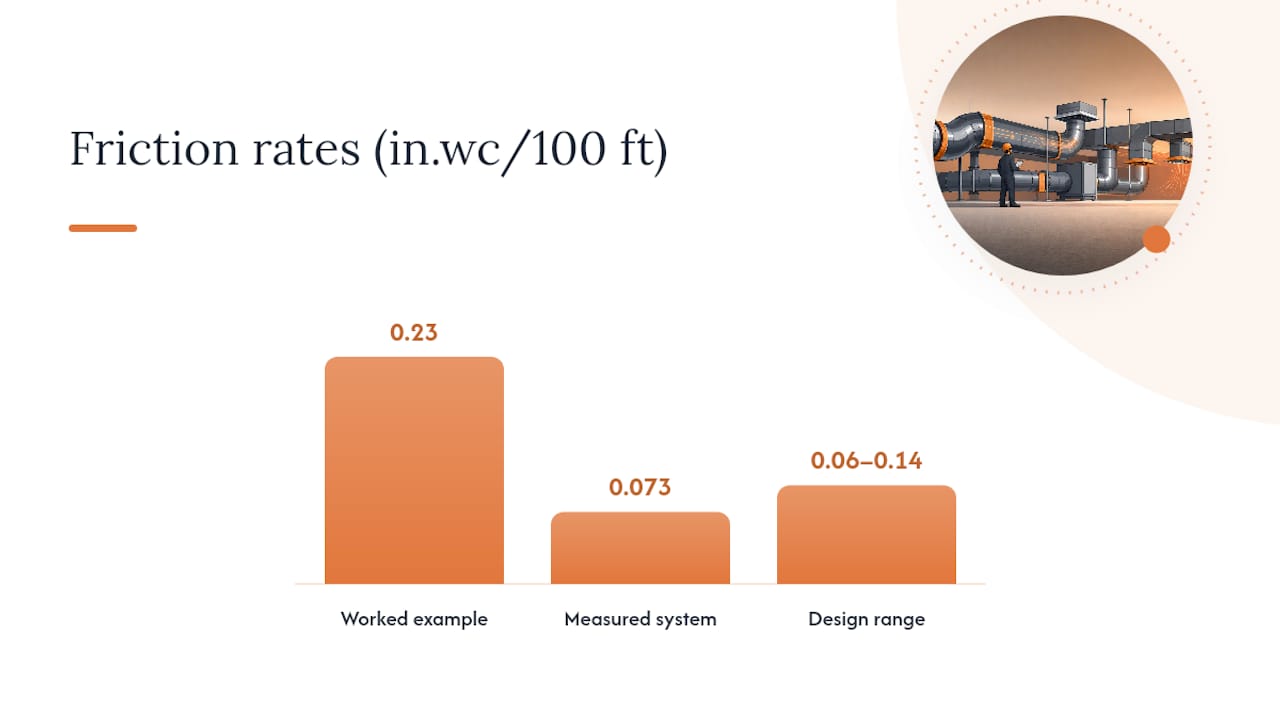
Here’s a worked example for a 3 ton system rated at 1,200 CFM. Say the blower delivers 0.50 in.wc of ESP at the design speed. Filter, coil, and grille losses total 0.27 in.wc, leaving an ASP of 0.23 in.wc. The critical path runs 60 feet of straight duct with fittings adding 40 feet of equivalent length, for a TEL of 100 feet. That gives FR = (0.23 × 100) / 100 = 0.23 in.wc per 100 feet, which is on the high end but usable. A comparable calculation using measured ASP and TEL produced 0.073 in.wc/100 ft in a different system, underscoring how much FR swings project to project. At 0.23 FR and 1,200 CFM, a 14 inch round trunk with 6 to 7 inch branches typically keeps velocities within the 900 fpm supply limit.
Getting Accurate Results From a Ductulator or Duct Calculator
A calculator is only as good as what you feed it. Whether you’re using a physical ductulator or an online tool, the results hinge on four inputs: design CFM, friction rate (or ASP and TEL if the tool calculates FR for you), duct material and roughness, and whether the chart behind the tool uses a fixed 100 foot reference or a variable-friction model.
The most common mistake is entering an assumed friction rate instead of computing one from ASP and TEL. A close second is ignoring component losses altogether, which inflates the ASP figure and produces undersized ducts. Rough or compressed flex duct also throws off results if the tool defaults to smooth-metal roughness values.
Cross-check any calculator output against a Manual D friction chart before committing to a size, and always verify final velocities and register sizing once the branches are set.
Does Duct Shape and Material Affect Sizing?
Round ducts carry less friction per unit of cross-sectional area than rectangular ducts of the same size, which is why most designers default to round trunks whenever the framing allows it. Rectangular runs need a shape-equivalency adjustment to convert their dimensions into an equivalent round diameter for friction calculations, a detail manufacturers who fabricate rectangular ductwork address directly in their sizing charts.
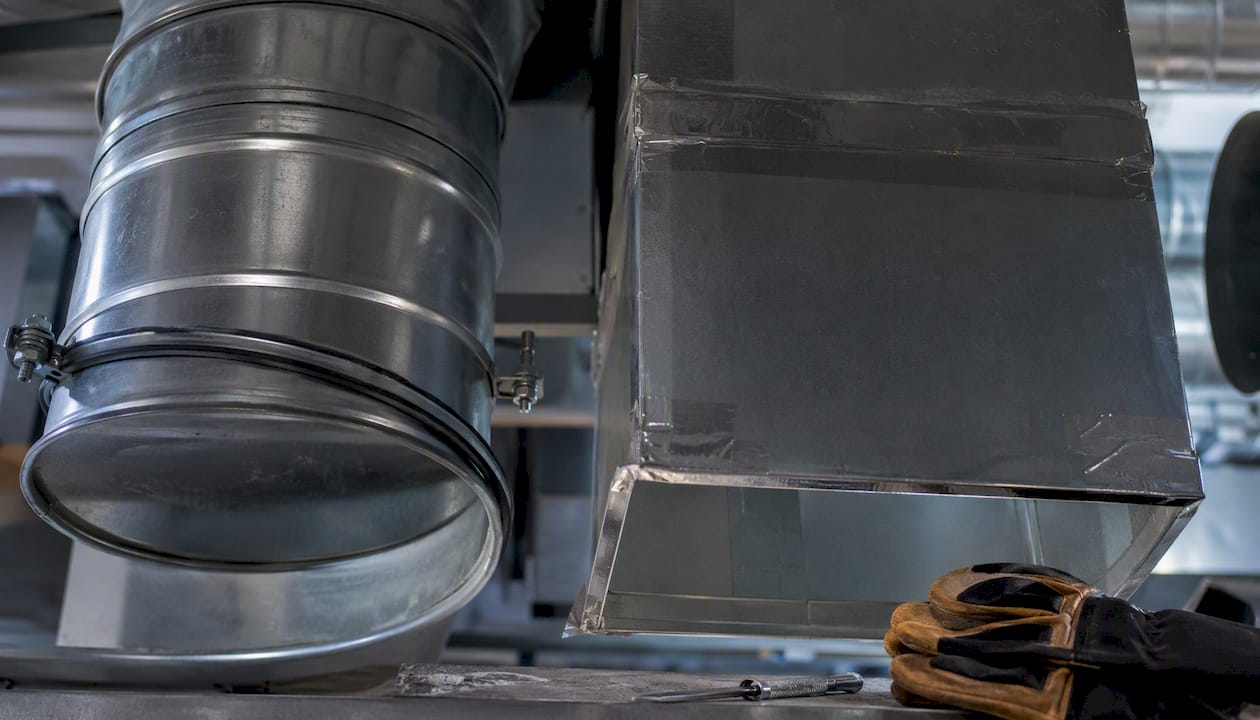
Material matters just as much. Smooth metal duct holds its shape and its friction values stay predictable. Flex duct is a different story: sag, compression at supports, and excess coiled length all add equivalent length that a straight-line measurement won’t catch. Manual D’s updated tables account for these flex-specific EL values, so pulling from the current edition rather than an older reference matters when a run is mostly flex. Poor flex installation is one of the few sizing problems that shows up entirely at install time, regardless of how clean the paper design was.
How Do You Diagnose Poorly Sized Ductwork?
A handful of symptoms point straight at sizing problems: high total external static pressure (TESP), a large temperature split across the coil, noisy registers, a frozen coil, short cycling, or rooms that never quite hit the thermostat setpoint. TESP readings above roughly 0.5 in.wc on a typical residential system are usually your first clue something’s undersized.
Work through it in this order:
- Measure TESP with probes on both sides of the air handler.
- Compare measured CFM against the original design CFM for that zone.
- Check filter and coil pressure drop, since a dirty filter mimics undersized duct symptoms.
- Trace the critical path’s actual TEL against what the original design assumed.
Fix filters and coils first, since that’s the cheapest and most common culprit. If that doesn’t resolve it, adjust dampers or resize individual registers before considering duct enlargement or a blower change, which are the most invasive and expensive fixes. Balanced airflow between rooms often comes down to correcting branch sizing rather than replacing equipment.
A Field Pro’s Take on Closing the Design Gap
Paper designs and finished installs rarely match perfectly, and the gap usually comes down to a few habits that are easy to build and easy to skip under deadline pressure.
- Walk the job site before finalizing sizes and measure actual TEL rather than estimating it from a floor plan.
- Get real pressure-drop numbers for filters and coils from the manufacturer instead of using a generic assumption.
- When a calculated size falls right on the line between two options, round up. The quieter system wins every time.
- Route for the shortest practical path and minimize fittings. Every elbow you eliminate is equivalent length you don’t have to account for.
- Hold installation crews to the same fabrication tolerances the design assumed. A design built around smooth metal doesn’t perform the same way once flex duct gets substituted in the field.
None of this replaces the Manual D calculation. It just keeps the finished system honest to what that calculation predicted.
Coordinating HVAC subcontractors, duct fabricators, and equipment suppliers on a single project usually creates more scheduling friction than the actual duct math does. Highlevelcrm-rconstructionsolutions was built around that exact problem, giving contractors a way to track subtrade communication, bid status, and project timelines in one place instead of scattered across email threads and spreadsheets. The CRM’s feature set includes automated lead tracking and custom reporting dashboards built specifically for construction workflows. Contractors managing HVAC, plumbing, and electrical subs together can see how it fits their trade mix on the industries served page.
Sources
- Manual D® Residential Duct Design - ACCA
- The Dos and Don’ts of Duct Design | Contracting Business
- Duct design 4 — Calculating friction rate | Energy Vanguard