Contractors: Reorder Automation to Protect ERP and Tame Lead Time
Inventory reorder automation continuously monitors stock and automatically triggers or drafts replenishment orders using data-driven reorder logic, so you maintain service levels while cutting carrying costs. It works best for businesses with recurring SKUs, multiple locations, or project-linked materials where manual counting eats hours and stockouts stall crews. The payoff shows up fast: fewer emergency runs, less cash tied up in shelves, and purchasing decisions that happen without someone staring at a spreadsheet every Monday.
TL;DR:
- Automated reorder systems can reduce stockouts by 30 to 50 percent within three months and prevent up to 95 percent of potential stockouts in some cases.
- Accurate safety stock calculation relies on analyzing historical demand and lead time variability, with dynamic formulas that adjust buffers based on real data.
- Implementation should start with a small pilot focusing on high-frequency, low-value SKUs, with phased expansion and clear success metrics to avoid automation failure.
- Reorder policies should be tailored: use min-max for stable SKUs, continuous review for fast-moving items, and forecast-driven models for high-variability or high-value stocks.
- Regular audit routines involving weekly, monthly, and quarterly reviews are essential to maintain system accuracy, recalculate safety stock, and adapt to changing supplier and demand conditions.
Table of Contents
- What Is Inventory Reorder Automation, Exactly?
- What ROI Should You Actually Expect?
- How Do You Calculate Reorder Points and Safety Stock?
- How Do You Roll Out Reorder Automation Without Breaking Things?
- Min-Max, Periodic Review, or Forecast-Driven: Which Reorder Policy Fits?
- How Do You Keep Reorder Automation Accurate Over Time?
- How Does This Work for Construction and Project-Based Inventory?
- Why Dynamic Safety Stock Beats a Flat Buffer Every Time
- What Do Most Teams Get Wrong When They Automate Reorders?
- Ready to Automate Reorders for Your Construction Business?
- Sources
What Is Inventory Reorder Automation, Exactly?
Reorder automation replaces manual “should we order more?” decisions with rules or models that watch stock levels and act on your behalf. Before you can automate anything, you need shared vocabulary across your team, because half of failed rollouts trace back to someone assuming “lead time” means something different than the person configuring the software.
Here’s what the core terms actually mean:
- Reorder point (ROP): the stock level that triggers a new order, calculated from demand during lead time plus a safety buffer.
- Safety stock: the cushion held above expected demand to absorb spikes in usage or delays in delivery.
- Reorder quantity (ROQ): how much to order once the trigger fires, whether that’s a fixed lot, an Economic Order Quantity, or a calculated top-up to a max level.
- In-transit vs. available inventory: stock already ordered but not received (in-transit) versus what’s physically on the shelf and unallocated (available). Systems that ignore the difference tend to double-order.
Automation modes split into two camps. Rule-based systems fire when a defined threshold is crossed, simple, auditable, and a smart place to start. Forecast-driven systems use historical and sometimes external data (seasonality, project schedules, promotions) to adjust triggers dynamically. Shopify’s own guidance on replenishment recommends most retailers start with rule-based logic before layering in forecasting, and that advice holds just as well for contractors managing job-site materials.
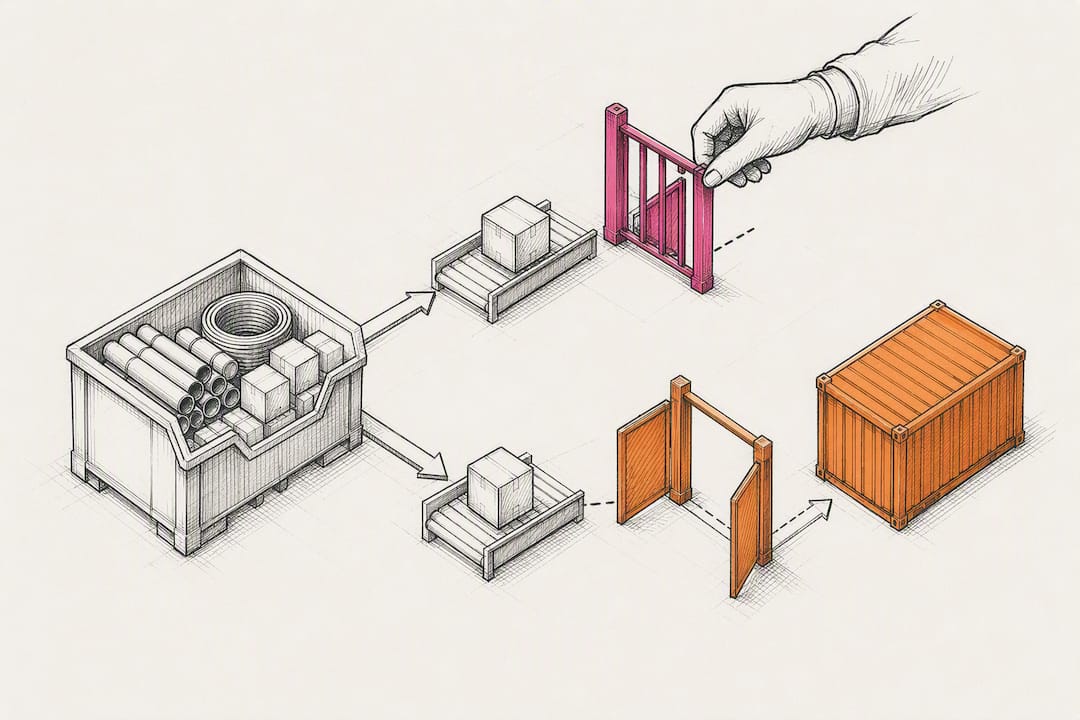
One more distinction matters: alerts versus auto-execution. An alert notifies a human to review and approve. Auto-execution drafts or sends the purchase order without a human touching it. Most mature operations run a hybrid: auto-execution for high-confidence, low-risk SKUs, and alerts for anything expensive, custom, or supplier-constrained.
What ROI Should You Actually Expect?
The financial case for reorder automation rests on four separate savings streams, and most articles blur them together. Separating them helps you build a business case your finance team will actually believe.
- Recovered revenue: fewer stockouts mean fewer lost sales or delayed jobs.
- Freed working capital: tighter, more accurate safety stock means less cash sitting on shelves as unsold or unused inventory.
- Rush-order savings: eliminating expedited freight and emergency supplier calls, which routinely cost 20 to 40 percent above standard pricing.
- Labor recovery: hours previously spent counting, calling suppliers, and re-keying orders get redirected to higher-value work.
By the Numbers: Automated reorder pipelines typically cut stockout incidents by 30 to 50 percent within 90 days of go-live, and median breakeven for small and mid-sized businesses often occurs within a few months, sometimes as soon as several weeks depending on SKU count. Some analysts report even sharper results: automated systems can prevent 85 to 95 percent of potential stockouts in certain retail and distribution studies, though results vary heavily by data quality and SKU complexity.
Businesses with predictable, recurring SKUs and stable supplier lead times see ROI fastest, because the math has less noise to filter out. Multi-location operations amplify the effect further; every location you add multiplies the manual reconciliation labor automation removes. If you’re running project-based work, like general contracting or subcontracting, the ROI shows up differently: fewer trips to the supply house mid-job, and materials showing up on-site instead of sitting in a warehouse three towns over.
How Do You Calculate Reorder Points and Safety Stock?
This is where reorder automation stops being a buzzword and starts being math you can check. Every automated trigger, no matter how sophisticated the software, still runs on these four inputs.
-
Clean your demand signal. Pull historical usage by SKU and location, and separate channels if you sell or issue materials through more than one (retail counter vs. job-site draw, for instance). Adjust for periods when you were out of stock. If a SKU shows zero demand during a two-week stockout, that’s not “no demand.” It’s missing data, and treating it as real will undercalculate your reorder point.
-
Track lead time and its variability. Don’t use the supplier’s quoted lead time. Log actual delivery dates against order dates for at least the last 10 to 20 orders per SKU or supplier. A supplier that quotes 7 days but delivers anywhere from 5 to 14 has lead-time variability that a static buffer can’t absorb.
-
Calculate safety stock dynamically. Static safety stock (“always keep 50 units on hand”) ignores the fact that demand and lead time both fluctuate. Inventory specialists recommend a Z-score approach that blends demand variability and lead-time variability into one formula:
Safety Stock = Z × √[(Average Lead Time × Demand Variance) + (Average Demand² × Lead-Time Variance)]
Say your a typical Z-score target is 1.65 for about 95 percent service level, with an example calculation producing a safety stock near 17 to 18 units depending on demand and lead-time variability, meaningfully different from a flat “just keep two weeks on hand” rule that ignores how erratic that supplier actually is.
-
Set the reorder point. ROP is calculated as average daily demand multiplied by average lead time plus safety stock. In the example above, that’s (8 × 10) + 18, or 98 units. When on-hand plus in-transit stock drops to 98, the system fires.
Reorder quantity still needs a policy, whether that’s Economic Order Quantity (EOQ) balancing ordering cost against holding cost, or a simpler min-max approach. Either way, respect supplier Minimum Order Quantities (MOQs), because a perfectly calculated ROQ that falls below a supplier’s MOQ just gets rounded up anyway, and your system should know that before it places the order.
How Do You Roll Out Reorder Automation Without Breaking Things?
A rushed rollout is the fastest way to make automation look like a bad idea. The businesses that get this right treat it as a phased project, not a software switch you flip on a Friday afternoon.
-
Pick a tight pilot. Choose 20 to 50 SKUs that are high-frequency, moderate-value, and have clean historical data. Skip your most expensive or most erratic items for round one. Set a clear success metric (stockout rate, order accuracy) and a fixed timeframe, typically 60 to 90 days.
-
Prep your data before you prep your software. Confirm SKU and variant granularity matches how you actually order (a “2x4x8 stud” and a “2x4x10 stud” are not interchangeable data points). Map every location that holds inventory. Decide how you’ll account for in-transit stock so it doesn’t get double-counted. Pull at least 12 months of historical demand where seasonality matters.
-
Prioritize integrations in this order: ERP read/write access first (your automation is only as good as the inventory data it can see and update), then WMS or IMS connections for warehouse-level accuracy, then mobile scanning for receiving. That last one matters more than most teams expect. Guided mobile scanning at receipt keeps on-hand balances accurate in near real time, which is the difference between a trustworthy trigger and one your team learns to ignore. Decide explicitly who holds write permission for auto-generated purchase orders. That’s a role decision, not a software setting.
-
Design your approval thresholds before go-live. Define a dollar or quantity ceiling below which orders auto-execute, and above which they route to a human. Build an exception path for expedited orders and supplier substitutions so the system doesn’t stall when reality doesn’t match the plan.
-
Gate your rollout. Don’t expand from pilot to full catalog until you’ve hit your pilot’s success metric for at least one full review cycle. Monitor forecast accuracy weekly during expansion, because errors compound faster across more SKUs.
Pro Tip: Run your pilot on SKUs where you already have a backup manual process. If the automation misfires in week two, you want a fallback that doesn’t involve a frantic call to your best supplier.
Min-Max, Periodic Review, or Forecast-Driven: Which Reorder Policy Fits?
Not every SKU should run on the same logic, and picking one policy for your entire catalog is a common early mistake. Each approach has a different sweet spot.
- Min-max: Simple threshold triggers. Order up to “max” whenever stock hits “min.” Best for stable, low-variability SKUs where the ROI of sophisticated forecasting doesn’t justify the setup effort.
- Periodic review: Stock gets evaluated on a fixed schedule (weekly, monthly) rather than continuously. Works well when supplier ordering cycles or freight consolidation make continuous ordering impractical.
- ROP-based continuous review: The system checks stock levels constantly and fires the moment the reorder point is crossed. Best for high-velocity SKUs where a delay of even a few days risks a stockout.
- Kanban/visual pull systems: Physical or digital signals trigger replenishment based on consumption, common on job sites and in lean manufacturing where simplicity beats precision.
- Forecast or AI-driven: Machine learning models adjust reorder triggers using demand patterns, seasonality, and sometimes external signals like weather or project schedules. A 2026 industry report found early adopters using predictive inventory AI cut stockouts by as much as 79 percent, though that figure reflects early-adopter results and shouldn’t be treated as a universal benchmark.
The practical guidance: use simple rules for your stable 80 percent, and reserve forecast-driven logic for the volatile, high-value SKUs where getting it wrong actually costs you. Layer in promotion calendars and channel allocation rules on top of whichever policy you choose, since a min-max threshold set before a big push or seasonal spike will trigger orders too late if nobody updates it beforehand.
How Do You Keep Reorder Automation Accurate Over Time?
Automation that runs unmonitored drifts. Suppliers change lead times, demand patterns shift, and a system calibrated in January can misfire by August if nobody’s checking.
Build a simple audit cadence:
- Weekly: Review exception queue orders that got flagged for human approval, and check for any SKU with unusual demand spikes.
- Monthly: Compare forecast accuracy against actual demand (Mean Absolute Percentage Error, or MAPE, is the standard metric) and recalculate safety stock for your highest-volume SKUs.
- Quarterly: Run a full supplier lead-time variance review and rescore supplier performance on On-Time-In-Full (OTIF) delivery.
Track these KPIs against realistic targets: stockout rate under 2 to 5 percent for critical SKUs, Days of Inventory on Hand (DOH) trending down without sacrificing service, inventory turns improving year over year, and OTIF above 90 percent for key suppliers.
Governance Note: Dynamic safety stock recalculated on a defined schedule outperforms static buffers precisely because supplier lead-time variance shifts throughout the year. A supplier whose variance climbs above your comfort threshold is a signal to either renegotiate terms or start qualifying a second source for that material category.
How Does This Work for Construction and Project-Based Inventory?
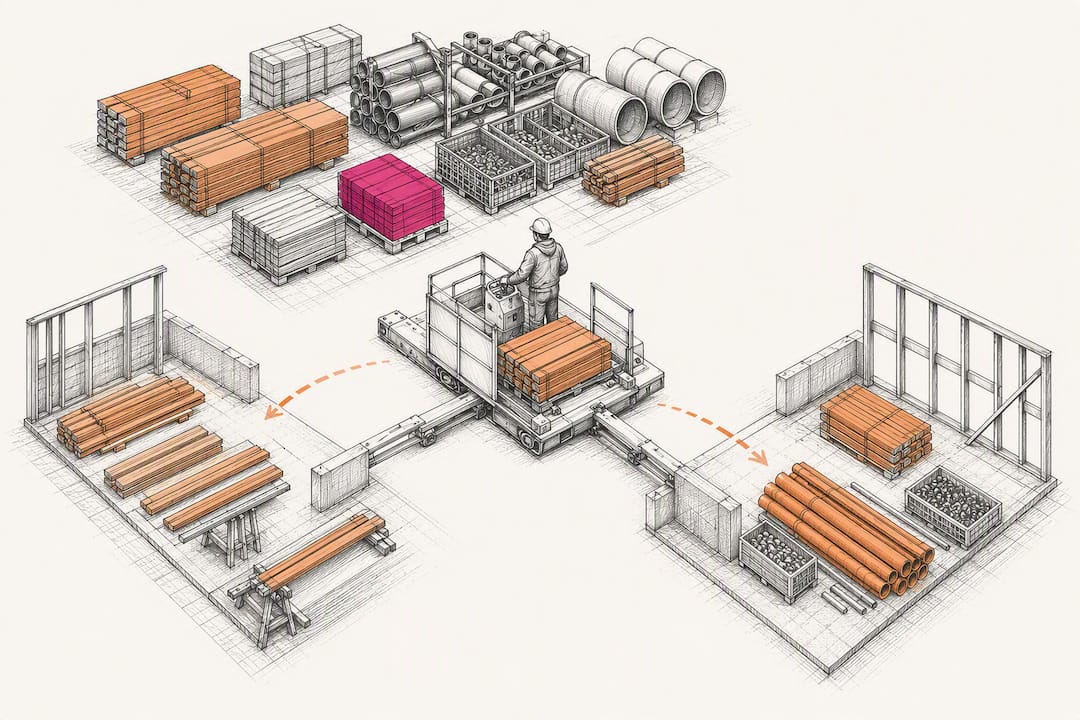
Contractors face a wrinkle warehouse-only retailers don’t: inventory has to reach a specific job site by a specific date, not just sit available somewhere. Schedule-linked replenishment ties reorder triggers to project timelines, not just consumption history, so a framing crew doesn’t show up to a site with no lumber because the warehouse “technically” had stock.
Construction-specific procurement automation that connects schedules to requisitions reduces material waste and stockouts while shortening procurement cycle times. A contractor running three active sites can consolidate purchase orders across projects to hit supplier volume discounts, then allocate received materials to the correct project the moment they arrive, so no single site quietly runs dry while the yard looks fully stocked. Highlevelcrm-rconstructionsolutions was built around this exact problem, drawing on over 30 years of construction industry experience, and clients using its inventory and bid tracking tools alongside automated lead tracking report conversion rate increases of up to 35 percent from better follow-up and fewer dropped estimates.
Why Dynamic Safety Stock Beats a Flat Buffer Every Time
Static safety stock is a guess dressed up as a policy. “Keep two weeks on hand” ignores that some SKUs have wildly consistent demand and others swing 300 percent month to month, and it ignores that your supplier’s lead time in November may look nothing like March.
Standard-deviation-based safety stock fixes this by treating variability as data, not a hunch. The formula weighs how much your demand actually fluctuates against how much your lead time actually fluctuates, then sizes the buffer to match your chosen service level, not an arbitrary week count someone picked years ago. A 95 percent service level target (Z-score of 1.65) means you’ll stock out roughly 1 in 20 replenishment cycles; a 99 percent target (Z-score of 2.33) costs more in carrying inventory but nearly eliminates stockouts for critical materials.

The practical shift most teams need to make: stop setting safety stock once a year and recalculating it as lead time and demand variance actually change. A supplier whose reliability slips over two quarters should trigger a higher buffer automatically, not after your third missed delivery makes it obvious. This is precisely where automation earns its cost. A human recalculating standard deviations across hundreds of SKUs every month isn’t a realistic expectation, but software running it continuously is.
What Do Most Teams Get Wrong When They Automate Reorders?
The biggest mistake I see isn’t choosing the wrong software. It’s skipping the data cleanup and expecting the algorithm to compensate for garbage inputs. Close behind that: teams remove human approval entirely on day one instead of easing into it, and they never revisit safety stock once it’s set.
If you’re starting from zero, prioritize in this order: run a small pilot, fix your demand and lead-time data, add mobile scanning at receiving, then formalize supplier lead-time SLAs. Everything else follows naturally once these four are solid.
One production note: any imagery accompanying this kind of operational content should reflect the actual diversity of the construction and supply chain workforce, varied in race and gender, not a single repeated archetype.
— Rowena
Ready to Automate Reorders for Your Construction Business?
Spreadsheets and gut-feel ordering cost contractors real money in rush freight, stalled crews, and lost bids. Highlevelcrm-rconstructionsolutions was built specifically to solve this, combining automated lead tracking, inventory and bid tracking, and supplier communication tools in one platform designed around construction workflows rather than retail ones. Explore how it fits your operation on the industries we serve page, where contractors, suppliers, and manufacturers can see which features map to their specific replenishment and project allocation needs.
Sources
- Predictive Inventory AI Cuts E-Commerce Stockouts by 79% in 2026 – Ecommerce Times
- What is safety stock and how to calculate and optimize buffer inventory – Incorta blog
- Best Demand Forecasting + Auto-Replenishment Tools Ranked – US Tech Automations
- Automated supply replenishment systems are… – Shopify Blog
- Inventory replenishment guide – Cleverence
Recommended
- Benefits of Automated Lead Follow-Up for Contractors
- Automate Follow-Up for Contractor Leads: 2026 Guide
- Automated Lead Tracking Explained for Contractors
- Optimize Construction Material Inventory Tracking
Signed up, or thinking about it? We build the inside of the account — pipelines, workflows, funnels, nurture, migration. Built for construction. Contact us.
Affiliate disclosure. We’re a GoHighLevel affiliate. Sign up through our link and we may earn a commission at no cost to you, or buy direct. Build-out is billed separately, never a software markup.