
Contractors: 35% Higher Lead Conversion From Bid Cycle Pipeline Reports
A useful construction pipeline report shows four things at a glance: total pipeline value, a stage breakdown built around your bid cycle, a short list of priority actions like bids due and stalled follow-ups, and four core KPIs (pipeline coverage, win rate, forecasted value, and average sales cycle). Construction adds its own demands on top: a way to flag dormant deals, attachments tied to each opportunity, and fast mobile entry from the truck or job site. A construction-specific CRM can generate these outputs without extra spreadsheet work.
TL;DR:
- A construction pipeline report should include total value, stage breakdown, priority actions, and four core KPIs, with additional flags for dormant deals and missing attachments.
- Contractors should track five to seven stages tailored to their bid-to-award cycle, ensuring each stage captures relevant fields like lead source, estimated value, and follow-up dates.
- A healthy pipeline coverage ratio typically ranges from three to four times the revenue target, indicating sufficient active opportunities to meet sales goals.
- Updating pipeline data in real time is crucial for accurate tracking, timely follow-ups, and effective decision-making, rather than relying on weekly batch updates.
- A construction-specific CRM with tailored stages and dashboards can improve lead conversion by about 35 percent compared to manual tracking methods.
Table of Contents
- What Pipeline Stages Should a Construction CRM Track?
- How Do You Build Pipeline Reports People Will Actually Use?
- Which Pipeline Metrics Actually Matter?
- How Do You Turn Pipeline Reports Into Weekly Action?
- Why Tailored Reports Beat Generic CRM Dashboards
- Get Pipeline Reporting Built Around Your Bid Cycle
- Sources
- FAQ
What Pipeline Stages Should a Construction CRM Track?
Generic sales pipelines don’t match how contractors actually win work. A construction pipeline should mirror your real bid-to-award cycle, and the most workable pipeline layouts use six or seven stages built around that cycle rather than a generic sales funnel.
Here’s a stage structure that fits most residential and commercial contractors:
- Lead — first contact, RFP notice, or referral
- Site visit/Qualification — scope confirmed, project is real and fundable
- Estimation — takeoff and pricing underway
- Bid submitted — proposal delivered, awaiting decision
- Award/Negotiation — verbal commitment or contract terms in discussion
- Active project — signed and handed to operations
- Lost/No-bid — closed out, with a reason logged
Each stage needs specific fields captured, not just a name change in the pipeline view. At minimum, track lead source, the general contractor’s contact name and role, estimated contract value, the assigned estimator, submission date, and links to drawings or proposal files. Every open deal also needs a follow-up trigger and a next action date, so nothing goes quiet without someone noticing. When a deal closes lost, record the reason immediately, while it’s still fresh.
Resist the urge to add stages for every internal nuance. Construction CRM practitioners consistently find that keeping the stage count around five to seven reduces friction and keeps adoption high. Start lean, and only add a stage when you can point to a specific gap it fixes. For dormant deals, tag them separately rather than letting them rot in “Estimation” for three months. A simple reactivation workflow, triggered after 30 days of no movement, keeps your pipeline value honest instead of inflated by deals that are really dead.
How Do You Build Pipeline Reports People Will Actually Use?
A report nobody opens is worse than no report at all. The reports that get used share one trait: they answer a specific question fast, without forcing anyone to filter or export first.
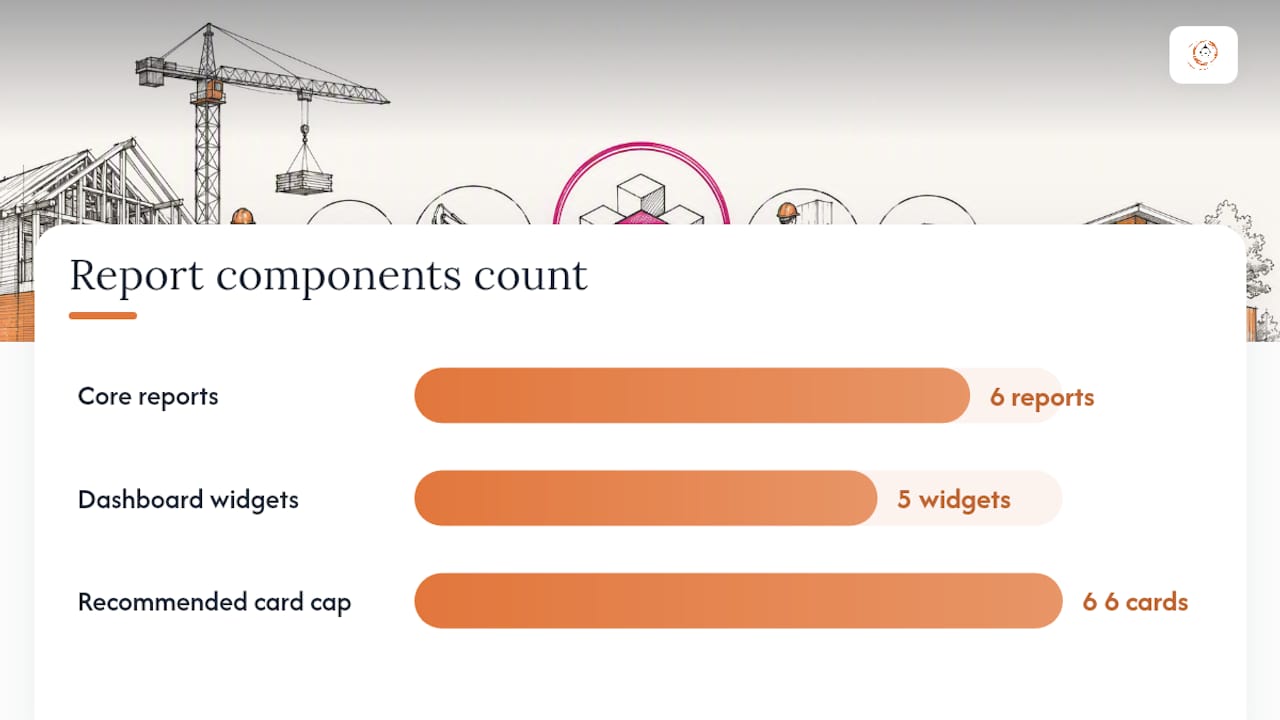
Build these six as your core set:
- Stage breakdown — dollar value and deal count in each stage
- Pipeline by estimator/rep — who’s carrying how much, and where it’s stuck
- Bids due this week — a rolling list, sorted by deadline
- Dormant deals — anything untouched past your reactivation threshold
- Attachments missing — flags deals lacking drawings, proposals, or contracts
- Loss-reason matrix — losses grouped by cause, not just by count
On the dashboard itself, five widgets do most of the work: funnel value by stage, the pipeline coverage ratio, upcoming deadlines, a win-rate sparkline showing trend over time, and top loss reasons ranked by frequency. Integrated dashboards that surface stage breakdowns and loss-reason analytics tend to connect sales activity to revenue outcomes far better than static spreadsheets ever do.
A few implementation details separate a report that gets used daily from one that gets ignored. Build mobile-first, since estimators and project managers update records from the field, not from a desk. Attach files automatically at the point of creation rather than as a manual afterthought. Add one-click export for the weekly review meeting. And give users filters for project type, region, and general contractor, so a commercial-only estimator isn’t scrolling past 40 residential remodels to find their own deals.
Pro Tip: Cap your main dashboard at six to eight cards. Every widget past that point gets skipped, and a dashboard people skim past is a dashboard that stops driving decisions.
Which Pipeline Metrics Actually Matter?
Four KPIs cover almost everything a construction sales leader needs to know, and each has a formula simple enough to calculate by hand if your CRM doesn’t already do it.
Pipeline coverage ratio divides total open pipeline value by your revenue target for the period. A ratio of 3x to 4x is generally considered healthy. Below that, you likely don’t have enough live opportunities to hit target even with a strong close rate.
Win rate is closed-won divided by total closed decisions (won plus lost). Break it out by estimator or project type, because a blended company-wide number hides which segments are actually working.
Forecasted value sums each open deal’s value multiplied by a stage-based probability weight. Calibrate these weights to your own historical win rates within the first two or three reporting cycles, rather than trusting the defaults indefinitely.
Average sales cycle is the average number of days from Lead to Award, counted only across won deals.
| KPI | Formula | Reporting cadence |
|---|---|---|
| Pipeline coverage ratio | Open pipeline value ÷ revenue target | Monthly |
| Win rate | Closed-won ÷ (closed-won + closed-lost) | Monthly, by estimator |
| Forecasted value | Sum of (deal value × stage probability) | Weekly |
| Average sales cycle | Avg. days from Lead to Award (won deals only) | Quarterly |
Conversion rate by lead source and loss-reason share deserve a place in the same report set. They tell you where to spend marketing dollars and which objections keep costing you bids. Pipeline coverage ratio and forecast accuracy have become standard benchmarks precisely because they translate raw activity into a number executives can act on. Show value, not just deal counts, in every executive-facing report. Counts hide the fact that ten small deals and two large ones can carry wildly different revenue weight.
How Do You Turn Pipeline Reports Into Weekly Action?
A report that sits unopened between meetings has no operational value; the routine around it matters as much as the data inside it.
- Run a weekly pipeline review with the sales lead, estimator lead, and an operations rep in the room. Surface the top ten at-risk deals by value, everything with a bid due in the next seven days, and any dormant deals crossing your reactivation threshold. Decide on the spot: escalate, reassign, or drop.
- Build three forecast scenarios — best, likely, and worst case — and update stage probabilities the moment a deal actually moves, not at the next scheduled review. Refresh the forecast mid-week when a large bid outcome could change near-term staffing or purchasing decisions.
- Set a strict follow-up cadence after every bid submission. Confirm receipt within 24 to 48 hours. Check in again at known decision milestones the GC has communicated. Log every contact and its outcome in the CRM record, in real time rather than from memory at week’s end, since delayed updates blur pipeline data and cause missed follow-ups.
- Move to “no-bid” after three unanswered follow-ups, and record the reason. A pipeline full of deals nobody’s tracked in six weeks isn’t a pipeline. It’s a graveyard with dollar signs attached.
Why Tailored Reports Beat Generic CRM Dashboards
Most CRM dashboards were built for software sales cycles measured in days, not construction bids measured in weeks with a general contractor’s decision process buried somewhere in the middle. That mismatch is the real reason so many contractors abandon their CRM within the first year: the reports simply don’t answer the questions a bid desk actually asks.
The data backs this up. Contractors using automated lead tracking and custom reporting dashboards report roughly a 35% improvement in lead conversion compared to manual tracking methods. That gap isn’t about better salesmanship. It’s about visibility. When a pipeline report is built around bid tracking specific to construction workflows, fewer deals slip through unnoticed, and fewer hours get lost to re-keying data between the CRM and project management software. That efficiency compounds every time a deal moves stages.
— Rowena
Get Pipeline Reporting Built Around Your Bid Cycle
This CRM is an alternative to using generic sales CRM software not designed specifically for construction workflows. Instead of forcing your bid-to-award cycle into someone else’s stage names, you get pipeline reporting built specifically for contractors from the ground up.
Services can include CRM customization, guided migration from spreadsheets or legacy systems, staff training, and automated reporting setup to surface value and KPIs without manual entry. On a demo call, clients can inquire about integrations, sample reports, mobile workflows for field teams, and onboarding timelines.
| What you get | Why it matters |
|---|---|
| Construction-specific stages | Matches typical bid cycles rather than generic sales funnels |
| Custom reporting dashboards | Surfaces KPIs and priority actions without manual export |
| Automated lead tracking | Associated with reported improvements in lead conversion |
| Migration and training support | Reduces setup time and adoption friction |
Visit Highlevelcrm-rconstructionsolutions to schedule a demo and see a sample pipeline report built around your own bid stages, or explore CRM migration options for construction companies if you’re moving off a legacy system.
Sources
- CRM for Construction Companies and Contractors
- Construction CRM: Build a Pipeline That Wins More Bids | BuildWorkPro
- Top Sales KPIs Every Construction Company Should Track
FAQ
What Should a Construction Pipeline Report Include?
At minimum, a stage breakdown by value, priority actions like bids due this week, and the four core KPIs: pipeline coverage ratio, win rate, forecasted value, and average sales cycle. Construction reports should also flag dormant deals and missing attachments, since those two gaps cause the most lost bids.
How Many Pipeline Stages Should a Contractor Track?
Five to seven stages work best for most contractors: Lead, Site visit/Qualification, Estimation, Bid submitted, Award/Negotiation, Active project, and Lost/No-bid. Adding more stages than that usually creates friction without adding useful detail.
What Is a Healthy Pipeline Coverage Ratio?
A pipeline coverage ratio several times your revenue target is generally considered healthy for construction sales pipelines. Below that range, you likely lack enough live opportunities to hit your target even with a strong close rate.
How Often Should Pipeline Data Be Updated?
Pipeline records should be updated in real time as site visits, bid changes, and client contacts happen, not batched into a weekly update. Waiting until a weekly catch-up tends to blur the data and causes missed follow-ups.
Does High Level CRM Support Custom Pipeline Reports?
Yes. High Level CRM builds custom reporting dashboards around construction-specific pipeline stages, and users report roughly a 35% improvement in lead conversion after adopting automated lead tracking and custom reports. Current pricing details are available on the Highlevelcrm-rconstructionsolutions site.
Recommended
- Benefits of Automated Lead Follow-Up for Contractors
- Automated Lead Tracking Explained for Contractors
- Automated Bid Follow-Up Explained for Contractors
- Improve Lead Conversion Using Contractor CRM in 2026
Signed up, or thinking about it? We build the inside of the account — pipelines, workflows, funnels, nurture, migration. Built for construction. Contact us.
Affiliate disclosure. We’re a GoHighLevel affiliate. Sign up through our link and we may earn a commission at no cost to you, or buy direct. Build-out is billed separately, never a software markup.