
12 Construction KPIs Contractors Must Track by Role and When to Act
Track cost, schedule, productivity, safety, quality, and backlog KPIs, and treat the Cost Performance Index (CPI) and Schedule Performance Index (SPI) as your two foundational calculations. A CPI or SPI below 1.0 signals you’re over budget or behind schedule right now, not next month. Most contractors get the best results tracking 5 to 12 KPIs total, each assigned to a specific owner who acts when the number moves.
TL;DR:
- Tracking at least five to twelve KPIs per project helps identify issues early without overwhelming teams with data.
- Financial KPIs like backlog-to-revenue ratio and overbilling/underbilling are critical for cash flow and lender review.
- Schedule and productivity metrics, including SPI, RFI turnaround, and crew utilization, reveal schedule slippages before they escalate.
- Safety and quality leading indicators predict incidents and quality issues, enabling preventative action ahead of lagging incident rates.
- Automated construction management software ensures data accuracy, role-specific dashboards, and timely alerts to support effective decision-making.
Table of Contents
- Core KPI Categories Every Contractor Should Track
- Financial KPIs: Formulas, Benchmarks, and What Lenders Watch
- Schedule and Productivity Metrics That Reveal Trouble Early
- Safety and Quality KPIs: Leading Indicators vs. Lagging Results
- Backlog and Pipeline KPIs for Capacity Planning
- How to Choose the Right KPIs for Your Team
- The Core Formulas: CPI, SPI, WIP, and Rework Rate
- Building Dashboards People Actually Trust
- Implementation Checklist: From Metrics to Action
- Integrating KPIs With Construction Management Software
- Reporting KPIs to Owners, Crews, and Executives
- Common Pitfalls That Undermine KPI Tracking
- What Changed When We Stopped Trusting Instinct
- A Practical Next Step for Automating Your KPI Tracking
- Sources
Core KPI Categories Every Contractor Should Track
Construction projects generate more data than any one dashboard can usefully display. The trick isn’t collecting more numbers. It’s picking the right ones for each job title.
Six categories cover almost everything that matters on a jobsite or in the back office:
- Financial — gross margin, backlog-to-revenue ratio, over/underbilling. Tells you whether the project is actually making money, not just staying busy.
- Schedule — SPI, milestone variance, float consumption. Flags slippage before it hits the critical path.
- Productivity — labor hours per unit of work, crew utilization rate. Shows whether field output matches the estimate.
- Safety — TRIR, near-miss reports, safety observation counts. Predicts incidents before they happen.
- Quality — rework rate, punch-list items per project, defect rate. Measures how much money you’re burning fixing your own mistakes.
- Backlog/sales — bid hit rate, backlog in months, pipeline conversion. Determines whether you’ll have work six months from now.
Each role cares about a different slice of this list. Field supervisors live and die by productivity and safety numbers because those are the metrics they can influence hour by hour. Project managers need the full spread, since they’re the ones who translate a lagging SPI into a staffing decision. Executives care most about backlog and gross margin trends across the whole portfolio, because those two numbers tell them whether the business is healthy twelve months out. A balanced KPI framework that adds safety, stakeholder, and environmental measures alongside the traditional cost/time/quality trio gives a fuller picture than financial numbers alone, and that fuller picture is increasingly what sureties and owners expect to see.
Financial KPIs: Formulas, Benchmarks, and What Lenders Watch
Money metrics tell you the truth faster than any other category, mostly because they’re the hardest to fudge. Three numbers deserve a permanent spot on your dashboard.
Work in progress (WIP) compares billed revenue to earned revenue on active jobs. Backlog-to-revenue ratio divides your signed, unstarted contract value by your trailing twelve-month revenue. Gross and net profit margin measure what’s left after direct costs, then after overhead.
- Overbilling means you’ve invoiced more than the work completed, which inflates near-term cash but creates a liability once the job catches up.
- Underbilling means completed work sits unbilled, which starves cash flow even on profitable jobs.
- A backlog-to-revenue ratio below a healthy range often signals a thin pipeline that needs attention before crews run out of work.
Surety and lender review: Banks and bonding companies typically review backlog-to-revenue and over/underbilling on a monthly basis when assessing a contractor’s bonding capacity and creditworthiness. If your WIP schedule looks messy to you, it looks worse to them.
Net margin below industry norms for your trade usually points to estimating errors or scope creep that never got billed as a change order. Catching that in month two of a job beats catching it at closeout, when there’s no room left to fix it. A budget pacing strategy built around monthly WIP reconciliation is one of the more reliable ways to keep overbilling and underbilling from compounding across a multi-month project.
Schedule and Productivity Metrics That Reveal Trouble Early
SPI, or Schedule Performance Index, is calculated as Earned Value divided by Planned Value. An SPI of 1.0 means you’re exactly on pace. Anything below that means less work got done than planned for this point in the schedule, and the gap tends to widen if nobody intervenes.
SPI and CPI often move together, but not always in the direction you’d expect. A crew can be ahead of schedule (SPI above 1.0) while blowing the budget to get there (CPI below 1.0), which is its own warning sign about overtime costs or subcontractor overruns.
Labor and process metrics fill in the “why” behind a sagging SPI:
- Output per labor hour compares planned units of work to actual units completed per crew hour.
- Crew utilization rate measures productive time against total time on the clock, catching idle time from material delays or poor sequencing.
- RFI and submittal turnaround tracks how long design questions and approvals take to close, since slow answers stall crews just as effectively as bad weather.
When RFIs pile up or submittal approvals drag, schedule KPIs feel it two or three weeks later. Watching those upstream numbers gives project managers a head start on the corrective conversation.
Safety and Quality KPIs: Leading Indicators vs. Lagging Results

Safety and quality numbers split cleanly into two families, and mixing them up is a common mistake. Leading indicators predict future problems. Lagging indicators report on problems that already happened.
Leading safety indicators include safety observation counts, near-miss reports, and training hours logged per worker. These numbers move before an incident does, which is exactly why they’re worth tracking even when nothing has gone wrong yet.
Lagging safety indicators include Total Recordable Incident Rate (TRIR) and Days Away, Restricted, or Transferred (DART) rate. These confirm what already occurred.
- A dropping trend in safety observations, even with no incidents yet, often precedes a spike in TRIR within a quarter.
- Rework rate, calculated as the cost of redone work divided by total project cost, is the clearest early signal of a quality problem spreading across trades.
- Punch-list item count per unit of work and defect rate at inspection round out the quality picture.
If observation counts drop two months running, the mitigation is simple: increase toolbox talk frequency and re-audit high-risk tasks before TRIR moves. If rework rate climbs past your historical average, pull the specific trade’s inspection records before the next phase starts, not after.
Backlog and Pipeline KPIs for Capacity Planning
Backlog in months of revenue is calculated by dividing signed, unstarted contract value by average monthly revenue. Most established contractors aim to keep this figure in a healthy range that gives them visibility several months out without locking them into work they can’t staff.
Bid hit rate (wins divided by total bids submitted) and estimate accuracy (estimated cost versus actual cost at completion) work together as forward-looking profitability signals. A contractor winning 40% of bids but consistently underestimating cost by 8% isn’t actually growing, just working harder for the same margin.
- Backlog in months tells you how far out your revenue is secured.
- Bid hit rate tells you whether your pricing is competitive or leaving margin on the table.
- Estimate accuracy tells you whether your backlog is actually as profitable as it looks on paper.
Use these three together for hiring decisions: rising backlog with a stable hit rate justifies bringing on crews now, not after the work starts.
How to Choose the Right KPIs for Your Team
Most contractors don’t fail at KPI tracking because they pick bad metrics. They fail because they try to track everything at once, and the dashboard becomes noise nobody checks.
- Start with your decisions, not your data. List the three or four decisions you make every week (staffing, billing, bidding, safety response), then work backward to the metric that actually informs each one.
- Separate leading from lagging KPIs. You need at least one leading indicator per category so you’re acting before a problem becomes a lagging statistic.
- Set your review cadence before you set your metrics. Daily field checks, weekly PM reviews, and monthly executive reviews each need different KPIs, not the same list at different speeds.
- Assign an owner to every KPI. A metric with no owner gets watched by everyone and acted on by no one.
- Cap your list at 12. Industry practice suggests 8 to 12 core metrics is the practical ceiling before data fatigue sets in and people stop looking.
Starter sets by role:
- Field supervisors: crew utilization, safety observations, rework rate.
- Project managers: CPI, SPI, RFI turnaround, punch-list completion.
- Executives: backlog-to-revenue, gross margin, bid hit rate, TRIR.
Pro Tip: Build your KPI list around a minimum viable data set first, such as job cost reports, backlog, and a safety log, and hold the definitions steady for at least several months before adding anything new. Changing your formulas mid-year makes trend lines meaningless.
The Core Formulas: CPI, SPI, WIP, and Rework Rate
These five calculations cover most of what you need, and every one of them works in a standard spreadsheet before you ever touch dedicated software.
CPI (Cost Performance Index) = Earned Value ÷ Actual Cost. A CPI of 0.90 means you’re getting $0.90 of value for every dollar spent, a warning sign worth a job-cost review.
SPI (Schedule Performance Index) = Earned Value ÷ Planned Value. An SPI of 0.85 means the project has completed 85% of the work it should have by this point.
WIP over/underbilling = Billed-to-date minus Earned revenue-to-date. A positive number is overbilling; negative is underbilling.
Rework rate = Cost of rework ÷ Total project cost, expressed as a percentage.
Backlog in months = Signed unstarted contract value ÷ Average monthly revenue.
| KPI | Formula | Below-target signal |
|---|---|---|
| CPI | Earned Value ÷ Actual Cost | Below 1.0: over budget |
| SPI | Earned Value ÷ Planned Value | Below 1.0: behind schedule |
| WIP variance | Billed to date − Earned to date | Large positive: overbilling risk |
| Rework rate | Rework cost ÷ Total project cost | Rising trend: quality slippage |
| Backlog (months) | Backlog value ÷ Avg. monthly revenue | Falling below target: pipeline risk |
The biggest pitfall isn’t the math, it’s the inputs. Earned Value depends on accurate percent-complete reporting from the field, and Actual Cost depends on job costs being coded correctly and on time. Feed either formula bad data and you get a confident, precise, completely wrong number.
Building Dashboards People Actually Trust
Dashboard design fails most often because it tries to show everyone everything. A field supervisor doesn’t need backlog-to-revenue on their screen, and an executive doesn’t need hourly crew utilization for one job. Organizing KPI data into role-specific views helps each audience spot problems in their lane faster, instead of scrolling past twenty metrics that don’t apply to them.
- Filter by role first, then by project, so each person opens the dashboard already looking at what matters to them.
- Cut any metric nobody has acted on in the last quarter. Vanity metrics dilute attention from the ones that drive decisions.
- Recommended cadence: daily field-level checks for safety and productivity, weekly PM reviews of CPI/SPI and RFI status, monthly executive reviews of backlog and margin trends.
Pro Tip: Before you trust any dashboard number, cross-check it against the original source document, the actual field report or the coded cost entry. Miscoded costs and delayed schedule updates are the single most common reason a CPI or SPI number looks fine on screen and wrong in reality.
Implementation Checklist: From Metrics to Action
A KPI without a matching action is just a number people ignore once the novelty wears off. Pairing every KPI with a predefined management response is what separates dashboards that change outcomes from dashboards that just look good in a meeting.
- Define your 5 to 12 KPIs by role, matched to real weekly decisions.
- Assign an owner to each metric, someone accountable for acting, not just reporting.
- Set thresholds and triggers in advance: CPI under 0.95 triggers a job-cost review; SPI under 0.90 triggers a schedule rebaseline and crew reallocation.
- Verify source data monthly against original field reports and cost codes.
- Configure the dashboard by role and set the review cadence for each one.
- Revisit the KPI list annually, not monthly, so trend data stays comparable year over year.
Sustainability matters more than sophistication here. A five-metric system everyone actually checks beats a twenty-metric system nobody opens.
Integrating KPIs With Construction Management Software
Manual KPI tracking works for a single job with a small crew. It breaks down fast once you’re running multiple projects with different foremen, different subs, and different reporting habits. That’s usually the point where contractors look at construction management software to pull job-cost, schedule, and field data into one place automatically.
The value isn’t just convenience. It’s data integrity. When field reports, cost coding, and schedule updates feed a dashboard automatically instead of getting re-typed from a spreadsheet, you eliminate the transcription errors that make CPI and SPI numbers unreliable in the first place. Software that connects directly to your accounting system also closes the gap between when a cost hits the books and when it shows up on your dashboard, which matters a lot when a CPI threshold is supposed to trigger action within days, not weeks.
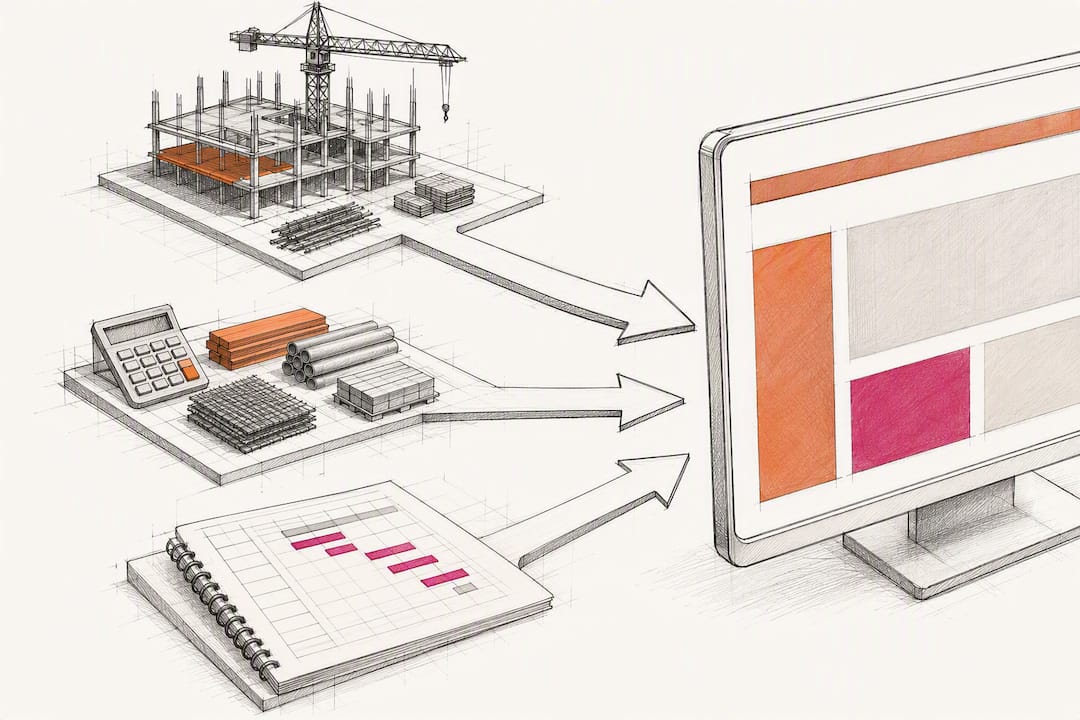
The features worth prioritizing when evaluating a platform: automated data pulls from job costing, custom reporting by role, and alerting when a KPI crosses a defined threshold. Integration with estimating tools also matters, since bid accuracy and estimate variance are only useful KPIs if the original estimate data is accessible without a manual re-entry step. A structured reporting framework built into your software, rather than bolted on with spreadsheets, is usually what makes the difference between KPIs that get reviewed weekly and KPIs that get reviewed once and forgotten.
Reporting KPIs to Owners, Crews, and Executives
The same KPI needs a different presentation depending on who’s reading it, and getting this wrong is why a lot of good data never changes a decision.
Field crews respond to simple, visual, immediate feedback: a safety observation count posted at the trailer, a productivity number tied to their specific scope. They don’t need a trend line going back six months. They need this week’s number and whether it’s better or worse than last week’s.
Project managers need context alongside the number: not just “SPI is 0.88” but SPI is 0.88 because submittal approvals on the mechanical package ran three weeks late. That context is what turns a metric into a decision.
Owners and executives care about trend and risk exposure more than any single data point. A margin that dipped one month but is recovering reads very differently from a margin in steady decline, and a report that shows the trend line prevents unnecessary panic or, worse, false confidence.
Subcontractors and suppliers, when they’re looped into KPI reporting at all, usually only need the metrics that affect their scope directly, schedule milestones and payment status, not your full financial dashboard. Sharing the right slice builds trust without oversharing internal numbers that aren’t their concern.
Common Pitfalls That Undermine KPI Tracking
The most expensive mistake in construction KPI tracking isn’t picking the wrong metric. It’s trusting a number without checking where it came from.
Field reports get submitted late or estimated loosely, cost codes get misapplied, and schedule updates lag behind actual progress on site. Every one of those small errors feeds directly into CPI and SPI, and a plausible looking dashboard number built on bad inputs can trigger exactly the wrong management response, cutting a crew that’s actually on pace, or missing a real overrun because the cost hadn’t been coded yet.
Tracking too many metrics is the second most common failure. Once a dashboard has thirty tiles on it, nobody owns any of them and review meetings turn into scrolling exercises instead of decision points.
The third pitfall is inconsistent definitions across projects or offices. If one PM calculates rework rate against labor cost only and another includes materials, the two numbers aren’t comparable, and any company-wide benchmark built on them is fiction. Standardizing formulas across every project before you compare them across projects isn’t optional, it’s the only way the comparison means anything at all.
What Changed When We Stopped Trusting Instinct
Contractors who move from gut-feel project management to disciplined KPI review tend to catch problems weeks earlier than they used to. That shift, from checking in when something feels off to checking in on a fixed schedule regardless of feeling, is usually where the real improvement in decision-making shows up. Margin fade gets caught in month two instead of at closeout. Rework gets flagged after the first bad inspection instead of after the third.
None of this requires perfect data. It requires consistent data, reviewed on a schedule, by someone whose job it is to act on what they see.
— Rowena
A Practical Next Step for Automating Your KPI Tracking
Manual dashboards and monthly spreadsheet reconciliation get you far, but they cost hours every week that a project manager could spend on the job instead of on data entry. A CRM platform was built specifically to close that gap for contractors, with automated lead tracking, workflow automation, and custom reporting dashboards that pull job data into one place instead of five.
Because the platform is built around construction workflows rather than adapted from a generic sales CRM, the KPI categories covered in this guide, financial, schedule, backlog, can feed directly into role-specific dashboards without a separate reporting tool bolted on the side. That matters most for contractors juggling multiple active jobs, where manual reconciliation of CPI, SPI, and backlog numbers across projects eats into the same hours a project manager needs for actual decision-making.
If your team is ready to see what automated, role-specific KPI dashboards look like for your own jobs, visit the Industries We Serve page to review the construction-specific features and schedule a demo.
Sources
- Cost Performance Index (CPI) vs Schedule Performance Index (SPI)
- Using dashboards to track construction KPIs
- Building success: Essential key performance indicators (KPIs) for contractors
Recommended
- Commercial Construction Software Comparison Checklist 2026
- Custom Reporting for Contractors: Your 2026 Field Guide
- How to Select Software for Multi-Project Contractors
- Construction CRM Implementation: A Practical Rollout Playbook
Signed up, or thinking about it? We build the inside of the account — pipelines, workflows, funnels, nurture, migration. Built for construction. Contact us.
Affiliate disclosure. We’re a GoHighLevel affiliate. Sign up through our link and we may earn a commission at no cost to you, or buy direct. Build-out is billed separately, never a software markup.